Midtown and Oakleigh Ranked as Mobile’s Friendliest Neighborhoods in Community Poll
A community poll of 40 Mobile residents ranked Midtown and Oakleigh as the city's friendliest neighborhoods, while West Mobile scored lowest.
Which Mobile neighborhoods are the friendliest? That question was put to local residents in a community poll that asked participants to rate their neighborhoods on measures of friendliness, and the results offered some interesting insights into the social fabric of the Port City. The exercise — informal, self-selected and small in scale — nonetheless mapped Mobile’s social geography in a way that residents will recognize, confirming some long-held assumptions about where neighbors know each other best and upending others.
Midtown and Oakleigh Lead the Rankings
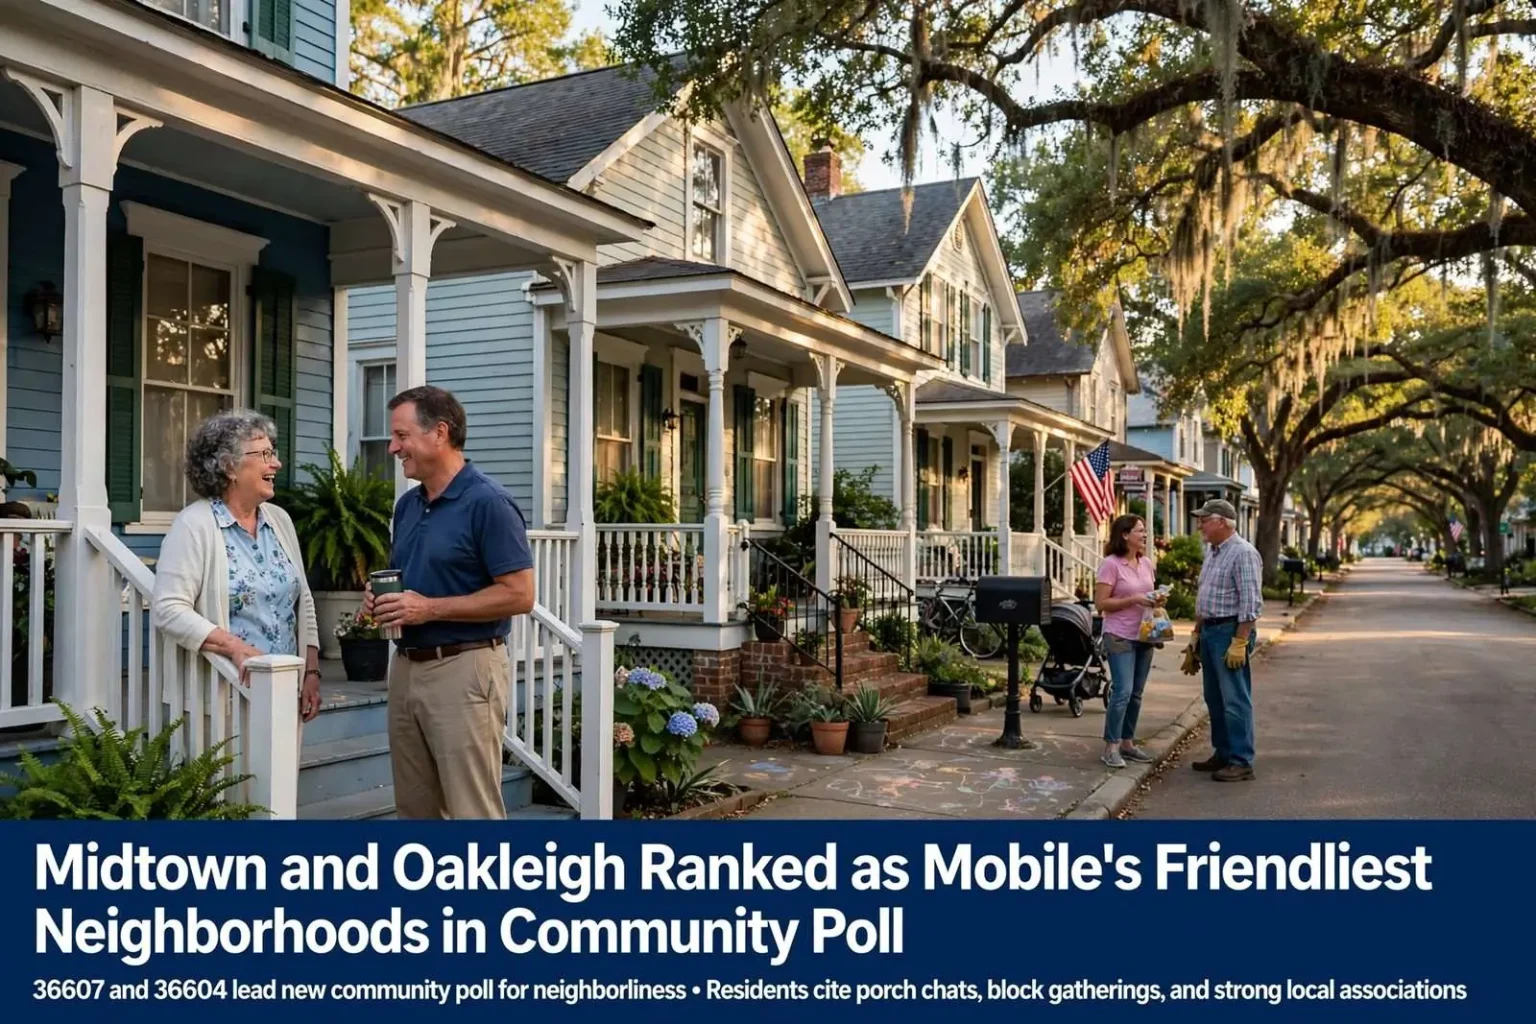
After tabulating responses from 40 participants across multiple zip codes, the 36607 zip code — encompassing parts of Midtown — earned the highest friendliness score of 3.5 out of a possible 4.0. Close behind was the 36604 zip code, home to the historic Oakleigh neighborhood, which scored 3.4. Respondents in these areas consistently reported high levels of neighborly interaction and a strong sense of community, describing streets where porch conversations, block gatherings and long-term residents still shape daily life.
Neighborhoods like Homer Place, Park Place, South Lafayette, and the streets surrounding Oakleigh Garden District all received top marks from residents who described their blocks as welcoming and socially connected. These are the parts of Mobile where historic bungalows and cottages sit close to the sidewalk, where front porches face tree-lined streets, and where neighborhood associations, garden clubs and walking groups have organized social life for generations. The poll’s top scorers share those physical traits, and the respondents’ comments reflected them.
The strength of the 36604 and 36607 scores will surprise no one who follows Mobile’s urban core. Midtown has spent the past two decades drawing new residents into restored historic homes, and the Oakleigh Garden District — anchored by the 1833 Oakleigh mansion and its surrounding historic streets — has long been among the city’s most active neighborhood organizations. Strong neighborhood associations tend to correlate directly with the kinds of interactions the poll measured: festivals, volunteer days, watch programs and the simple accumulation of neighbors who have known each other for years.
Spring Hill and Western Mobile Fall Behind
The 36608 zip code, covering the Spring Hill area, came in at a more moderate 2.8, with responses varying widely between different pockets of the neighborhood. While some residents of Spring Hill Manor and Willowbrook rated their communities very highly, others in the broader Spring Hill area gave notably lower scores. The variation tracks the neighborhood’s own patchwork character, where older streets near Spring Hill College and the historic village center coexist with larger tracts of mid-century development where homes sit farther apart behind screens of trees and hedges.
Further west, the 36609 zip code — which includes neighborhoods like Pinehurst and Greenwich Hills — scored 2.6, and the 36695 zip code in West Mobile brought up the rear with a score of just 2.0. West Mobile’s low aggregate score reflects the city’s newest growth patterns: subdivisions built in recent decades around arterial roads, where residents commute outward by car and social ties often center on schools, churches and workplaces rather than the immediate street.
Within 36695, scores ranged dramatically: Heritage Hills residents gave their neighborhood near-perfect marks, while others in Sugar Pine Estates and other communities rated friendliness quite low. The spread is the poll’s most instructive finding, because it shows that even in the lower-scoring corners of the map, individual neighborhoods can sustain the kind of connection that residents in the historic core take for granted.
Challenging Conventional Wisdom
The results both confirmed and challenged common assumptions about Mobile’s neighborhoods. A prevailing belief held that the farther west one traveled in the city, the more isolated the communities became — and the overall trend in the data did bear that out, with the highest-scoring zip codes concentrated in the historic urban core. That east-to-west gradient mirrors the city’s physical development: the older neighborhoods near the bay were built on a walkable grid before the automobile reshaped residential design, while West Mobile grew outward in the era of cul-de-sacs and collector roads.
However, the wide variation within individual zip codes suggested that friendliness was often a block-by-block phenomenon rather than a citywide pattern. Even in lower-scoring areas, individual neighborhoods with strong community bonds stood out as exceptions. A subdivision can build social infrastructure the same way it builds streets — through an active homeowners association, a shared pool or clubhouse, an annual cookout — and the poll’s outliers suggest those investments matter more than geography.
That block-by-block reading also carries a caution about the poll itself. With 40 respondents spread across multiple zip codes, a handful of enthusiastic or disgruntled participants could shift a neighborhood’s average, and self-selected respondents are, by definition, people engaged enough to answer a survey about their neighbors. The scores are best read as a snapshot of civic sentiment rather than a scientific ranking.
Historic Neighborhoods Show Strong Community Ties
The data revealed that many of Mobile’s historic neighborhoods — particularly those in the Oakleigh Garden District, DeTonti Square, and the Midtown corridor — fostered especially strong neighborly connections. These areas, characterized by walkable streets, front porches, and established community traditions, consistently outperformed newer suburban developments in friendliness ratings. The built environment is hard to separate from the social one: houses near the sidewalk, short setbacks and connected streets create the casual, repeated encounters that turn residents into neighbors, while garages and long driveways reduce the same opportunities.
Neighborhoods like Brookwood in the 36606 zip code, Fulton, and the Westlawn area produced mixed results, contributing to that zip code’s overall average of 2.7 — respectable but well behind the historic core neighborhoods to the east. Those communities sit in the transitional band between Midtown and West Mobile, where mid-century housing stock meets commercial corridors, and their mixed scores echo the transitions underway in the neighborhoods themselves.
For civic leaders, the poll offers a rough map of where community-building investments might matter most. Mobile’s neighborhood services programs, association grants and cleanup initiatives already concentrate on building organizational capacity in areas where it is thin, and the areas that scored lowest — the newer subdivisions of the far west — are precisely where those tools have the most room to work. The historic core, meanwhile, demonstrates what the payoff looks like when neighborly ties are strong: lower turnover, engaged associations and the kind of informal watchfulness that no program can manufacture.
Whether the rankings change in future rounds of polling depends on trends already visible across the city. New subdivisions age into communities, sidewalks and infill development are gradually reconnecting corridors west of Midtown, and the popularity of the historic districts keeps drawing new families into the neighborhoods that topped this poll. The friendliness that respondents in 36607 and 36604 described is the product of decades of daily habit — and, the results suggest, it can be built anywhere in the Port City that residents decide to practice it.
What Makes a Neighborhood Friendly
The poll’s findings line up with what urban researchers have documented in cities across the country: the design of a neighborhood shapes the quantity and quality of contact between the people who live there. Gridded historic districts like those around Oakleigh put dozens of front doors within a few steps of the sidewalk, and residents walking to shops, parks or a neighbor’s house cross paths with the same faces daily. Over years, those repeated low-stakes encounters compound into the familiarity that respondents in the top-scoring zip codes described — names exchanged across yards, favors between adjacent houses, a shared sense of who belongs on the block.
Newer development, by contrast, often routes daily life through garage doors and windshield time. Subdivisions built around cul-de-sacs can paradoxically be both intimate and isolating: the dozen houses on a loop may know each other well, while the subdivision as a whole functions as a series of disconnected islands. The dramatic spread within West Mobile’s 36695 zip code — near-perfect scores in Heritage Hills alongside very low scores in Sugar Pine Estates — is exactly what that model predicts.
Community institutions do the rest. The neighborhoods that topped the poll support long-running associations that stage events, publish newsletters, organize crime prevention programs and give residents a structure for showing up together. DeTonti Square, one of Mobile’s oldest residential districts, and the Oakleigh Garden District both sustain that kind of organizational muscle, and their high marks are the natural result. In areas without such institutions, friendliness depends entirely on individual initiative, which is why scores there fluctuate block to block.
Reading the Numbers With Care
For all its suggestiveness, the poll is a conversation starter rather than a definitive measure. Forty respondents cannot represent a city of nearly 200,000, and the 4.0 scale invites generous scoring from satisfied residents and harsh scoring from frustrated ones. Differences of a few tenths between zip codes may mean little, while the gap between the historic core and the far west — a full 1.5 points — almost certainly means something real.
The most useful takeaway may be the variation within neighborhoods rather than between them. In nearly every zip code surveyed, respondents painted sharply different pictures of life on different streets, which argues for treating “Mobile friendliness” as thousands of block-level stories rather than a single citywide trait. A resident unhappy with the connections on a quiet suburban street can find in the data both an explanation — the built and social environment does the work in the historic core — and a to-do list for building it at home.
The poll also captures Mobile at a moment of transition in its neighborhood geography. Investment continues to flow into Midtown and the historic districts, drawing new households into the walkable core where the survey found the strongest ties, while West Mobile’s established subdivisions are aging into their second and third generations of owners, some of whom are building the association structures their neighborhoods never had. If the poll were repeated in a few years, the map might look different — and the neighborhoods that top it will likely be the ones where residents treated friendliness as something to be built, not merely rated.