
Report: Local hospitals nearing max capacity as COVID-19 cases surge
Data shared by The New York Times showed Mobile-area hospitals nearing maximum capacity as a summer COVID-19 surge drove up hospitalizations.
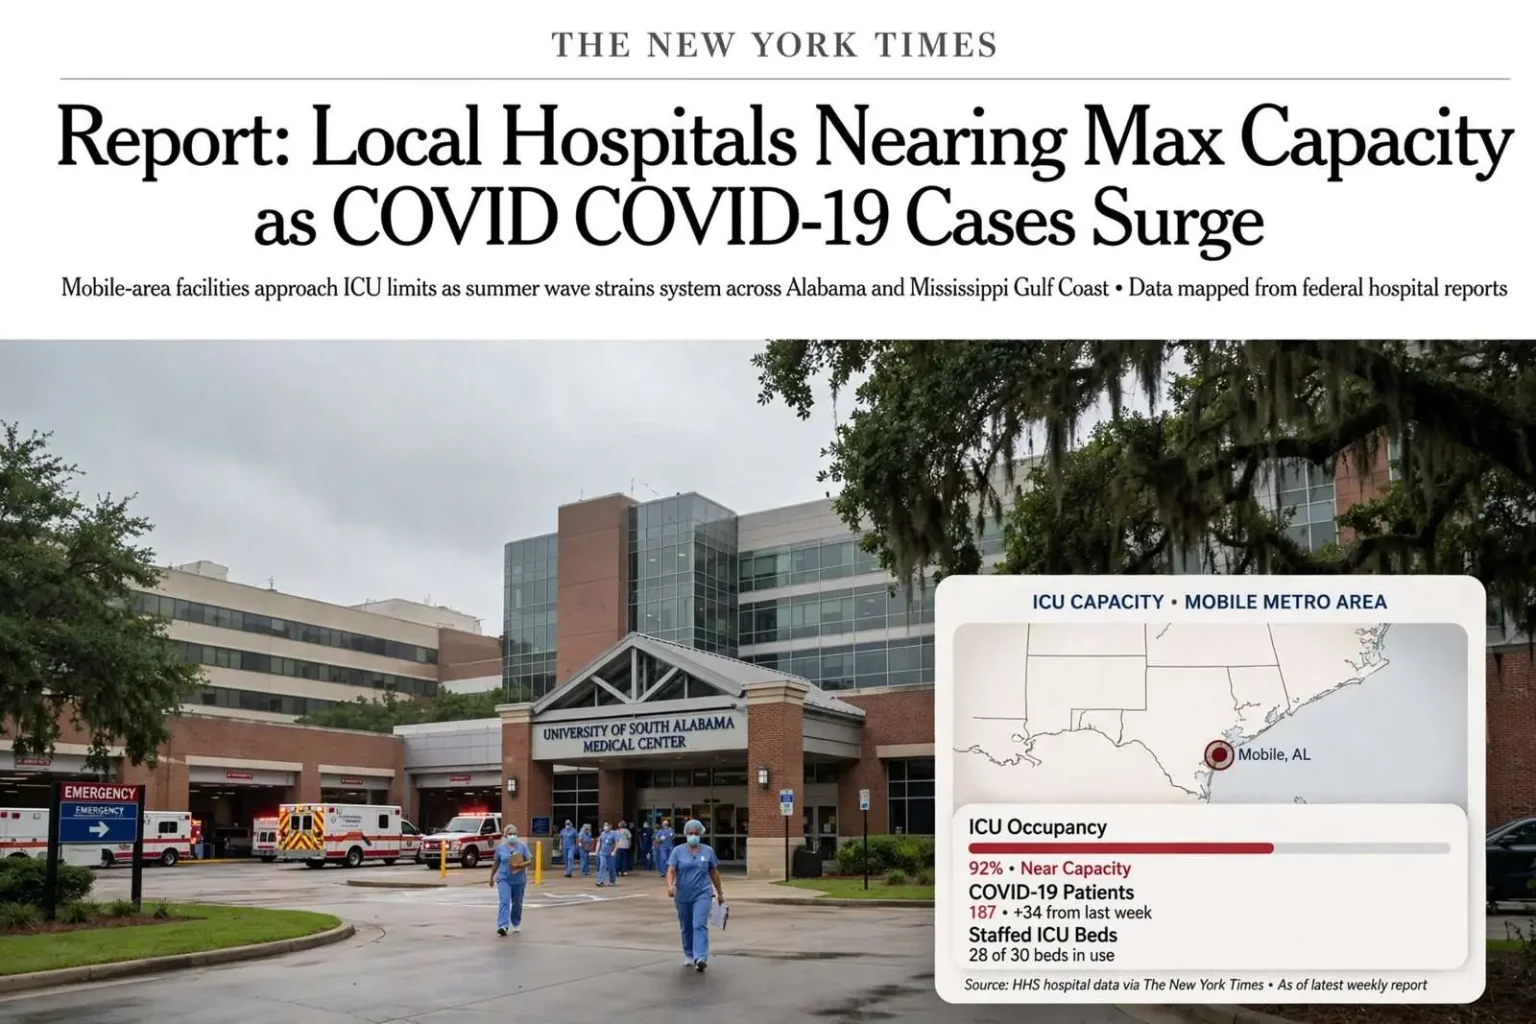
Local hospitals in the Mobile area were reported to be approaching maximum capacity as COVID-19 cases surged, according to data highlighted by The New York Times. The newspaper published an interactive map showing hospital ICU capacity and the number of COVID-19 patients by region, and for the Mobile area, the figures indicated hospital occupancy was pushing toward its limit. The report gave readers across the Gulf Coast a rare region-by-region look at how close their hospitals were running to the edge.
The Times’s mapping project drew on figures hospitals submit to the federal government, translating raw facility reports into a visual picture of strain across the country. For Mobile, a metro that serves not only its own residents but patients drawn from a wide swath of southwest Alabama and the Mississippi Gulf Coast, the numbers landing near the ceiling of capacity carried implications well beyond the city limits.
Regional hospitals function as a safety net for the entire area. Patients from Washington, Clarke, and Monroe counties in Alabama, and from Jackson and George counties across the Mississippi line, are routinely transferred to Mobile’s larger medical centers when local facilities cannot provide the level of care required. When ICU beds in Mobile run short, the shortage ripples outward across the whole region, because the referral options that normally absorb overflow are the very facilities under pressure.
What the data showed, and why it moves
The Times noted the numbers can shift from week to week, because hospitals report occupancy on a rolling basis and the data reflects figures submitted to the federal government. Occupancy counts are snapshots, not permanent conditions: a hospital that reports near-full ICU utilization this week may admit fewer critical patients next week, while another that looked comfortable can tip toward capacity as admissions from a single cluster of infections arrive.
That volatility is a feature of how hospital data is collected rather than a flaw in it. Facilities report to federal health authorities on regular schedules, and the published figures lag the bedside reality by however long that reporting cycle runs. Experts cautioned that conditions on the ground can change quickly, sometimes faster than the public data can reflect, which is why health officials urged readers to treat the map as a trend signal rather than a real-time dashboard.
The strain arrived as a summer wave of infections drove up hospitalizations across Alabama and the South, renewing pressure on intensive care units and the staff who care for the sickest patients. Summer surges had already become a pattern of the pandemic in the region, with hot weather driving gatherings indoors into air conditioning and travel seasons mixing populations across state lines.
How a surge strains more than beds
Capacity is about more than physical beds. An ICU bed only counts as available when it can be staffed, and nursing shortages that plagued hospitals nationwide meant that even facilities with empty bed frames could not always staff them. When COVID-19 admissions climb, the pressure compounds: infection control protocols slow admissions and transfers, elective procedures get postponed, and staff members who themselves test positive or quarantine subtract from the workforce at the very moment demand peaks.
For Mobile’s major medical centers, including the academic medical center that anchors the region’s highest-level care, a surge wave changes the rhythm of the entire institution. Elective surgeries are rescheduled to free beds and staff, emergency departments hold admitted patients longer while awaiting ICU placement, and rural hospitals that would normally transfer stable patients are asked to hold them longer because the receiving facilities have no room.
The human geography of the Gulf Coast amplifies these dynamics. Mobile sits at the center of a multi-state region where critical access hospitals and small rural facilities are scattered across long distances. When a patient in Grove Hill or Chatom deteriorates, the ambulance or helicopter ride to Mobile is the plan, and the system works only if Mobile has capacity to receive. Reports of the city’s hospitals nearing maximum capacity therefore read as an alarm for the whole region, not a single city.
The New York Times project was part of a broader shift during the pandemic toward publishing hospital-level and regional-level data that had previously lived inside health systems. By mapping ICU capacity and COVID-19 patient counts by region, the newspaper let residents compare their own community’s trajectory against neighboring areas, and let local officials see in one glance which parts of the state were closest to the breaking point.
Public health researchers noted both the value and the limits of such data. Reporting standards evolved during the pandemic, definitions of ICU beds shifted as facilities expanded critical care capacity, and a bed listed as open might be unusable for a new patient because of staffing. Still, the aggregate picture, repeated across multiple waves of the pandemic, reliably showed the same thing: surges moved fast, and hospitals moved slowly in comparison.
What near-capacity means for patients and families
For residents of the Mobile area, the practical meaning of a near-capacity report showed up in waiting rooms and transfer calls. Patients arriving at emergency departments with serious illness faced longer waits for inpatient beds. Families hoping to transfer a loved one from a smaller hospital to a Mobile ICU sometimes waited hours or days for a placement. Elective procedures, from joint replacements to cardiac interventions, were deferred, pushing care further down the calendar and, in some cases, allowing conditions to worsen before treatment.
Health officials used the periods of peak strain to repeat the same core messages: vaccination, masking in crowded indoor settings, and avoiding emergency departments for mild symptoms that a primary care provider or urgent care clinic could handle. Keeping non-emergency patients out of crowded ERs was framed as a way to preserve capacity for the genuinely critically ill, a message that mattered most precisely when the data showed hospitals nearing their limits.
The summer wave also tested the coordination mechanisms built over the course of the pandemic. State health authorities tracked bed availability across regions to steer transfers, and hospitals leaned on mutual aid arrangements to move patients toward whatever facility, wherever in the region, had space and staff. Those systems were designed for exactly the conditions the Times data captured, and their effectiveness depended on there being capacity somewhere to absorb the overflow.
Watching the trend lines
Because the figures moved week to week, the more meaningful signal was the direction of travel. A region whose occupancy hovered near the ceiling for consecutive reporting periods was in a fundamentally different position than one that spiked briefly and eased. Sustained near-capacity operation leaves no margin for a mass-casualty event, a natural disaster, or a staff outage, any of which independently strains a hospital system in an ordinary year.
On the Gulf Coast, that margin question carries special weight during hurricane season. A hospital system running at maximum occupancy during the summer surge months is simultaneously in the months when a landfalling storm can force evacuations, damage facilities, and flood the region with injuries. Emergency planners have long warned that pandemic strain and hurricane readiness interact, and the summer wave’s timing overlapped with the height of the Atlantic season.
The Times’s regional figures gave Gulf Coast readers a way to see that vulnerability in numbers rather than anecdotes. For the Mobile area, a community whose hospitals serve as the referral backbone for both southwest Alabama and coastal Mississippi, the data showing occupancy pushing toward the limit was a warning about the strength of the entire regional safety net, and a reminder that the course of a surge could shift faster than any weekly report could capture.
As the wave played out, the metrics to watch remained the same ones the interactive map tracked: ICU occupancy, COVID-19 patient counts, and the week-over-week direction of both. Hospital leaders, public health officials, and residents alike watched those numbers, knowing that the distance between near-capacity and full capacity could be measured in a handful of admissions and a few days of time.
The episode also underscored how differently the same data reads depending on where a person sits in the health system. To a hospital administrator, near-capacity figures drive staffing calls, transfer negotiations, and the painful arithmetic of postponing elective work. To a rural physician in a surrounding county, they shape whether a deteriorating patient can be moved and how quickly. To a family deciding whether to gather indoors over a summer weekend, the numbers are a quiet argument for caution.
What the Times highlighted for Mobile was, in the end, a portrait of a regional system doing its job under stress: hospitals absorbing a rising tide of patients, staff stretched thin but continuing to admit and treat, and public data giving the community an honest account of how narrow the margin had become. The figures could shift the following week, as the newspaper noted, but while they sat near the maximum, every admission and every transfer in the region passed through a system with almost nothing left to spare.