
University of South Alabama Mobile
How South Alabama Jaguars Football Attendance Numbers Are Actually Counted
After a Jaguars home game drew a lower-than-expected crowd count, University of South Alabama officials explained how attendance is calculated.
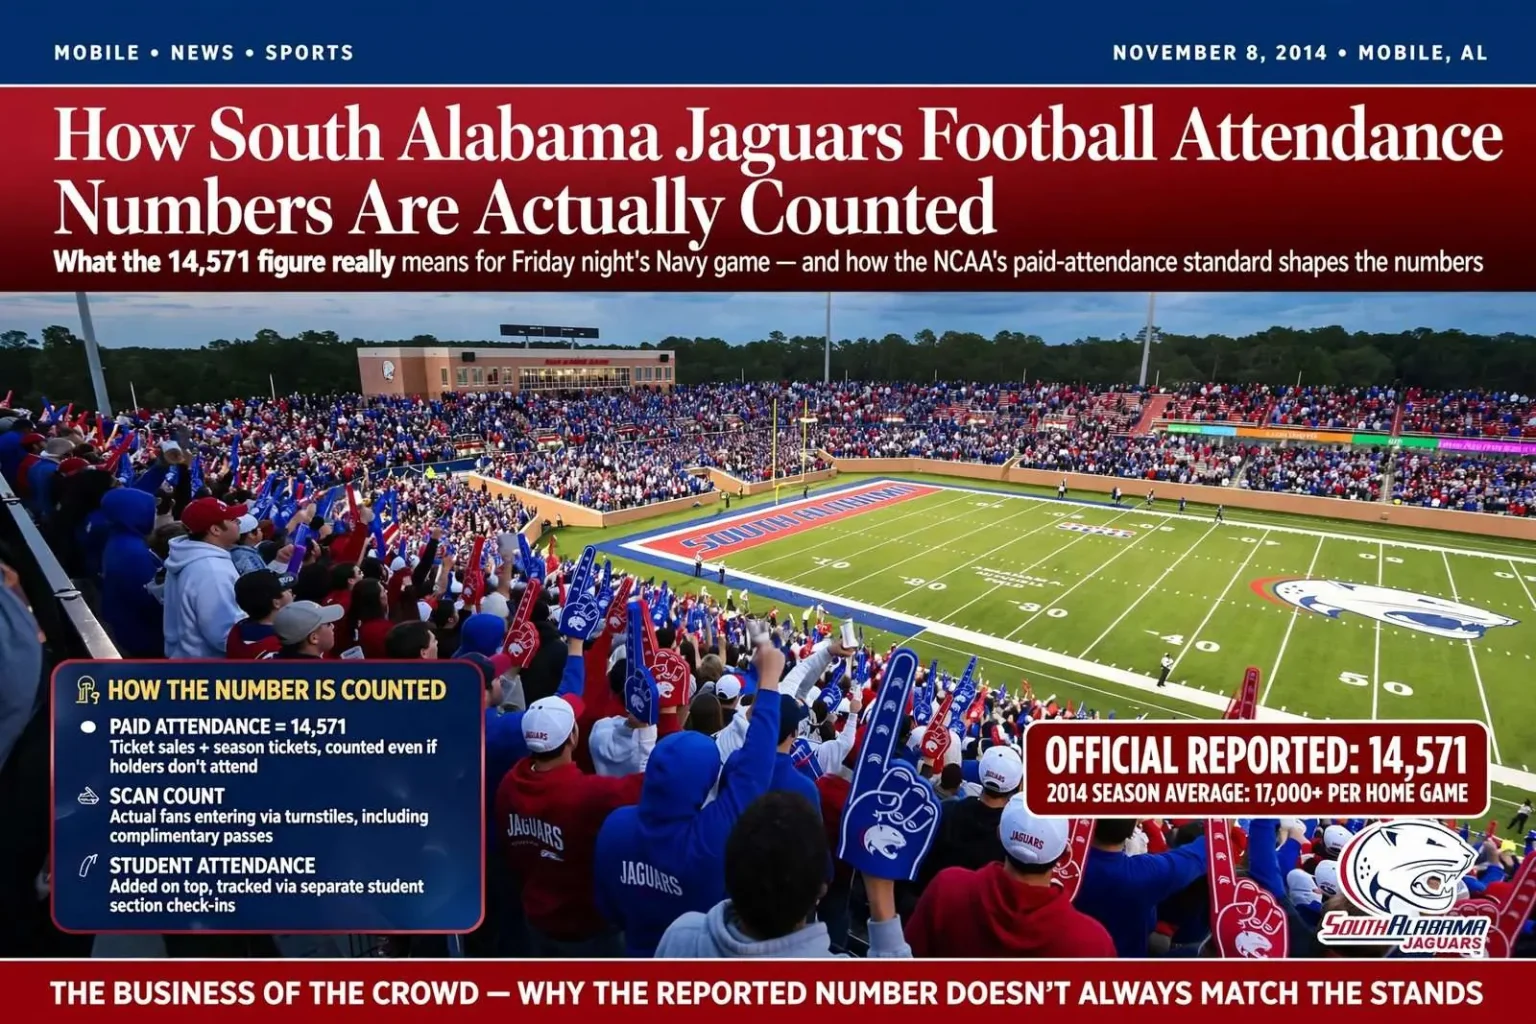
A relatively modest attendance figure announced during a University of South Alabama Jaguars home football game this fall sparked a round of questions among fans about how the school actually counts the people in the stands, prompting officials to lay out the methodology behind the numbers. What started as a single stat on a Friday night turned into a broader lesson in how college football attendance is measured — and why the number on the scoreboard rarely matches what the naked eye sees from the concourse.
The debate picked up after South Alabama’s announced attendance came in at 14,571 for a Friday night home game against Navy, a figure that struck several longtime fans as low compared to the crowds they remembered seeing in the stands that night. The matchup against the Midshipmen, with the visiting fan base and the national profile that comes with a service academy program, had drawn one of the more enthusiastic crowds of the season, and the gap between perception and the announced figure was hard for some supporters to square.
A lengthy thread on a South Alabama Jaguars fan page followed, with fans trading theories about how tickets, no-shows and student attendance factor into the final number, but arriving at few definitive answers. Some guessed the school counted season tickets sold regardless of whether the holder showed up. Others suspected complimentary tickets were involved, or that the figure included groups and promotions. The theories varied, but the core question was the same: was 14,571 a count of butts in seats, or something else entirely?
The NCAA counting standard
University officials said the figure follows standard NCAA guidelines used across college football, which rely primarily on paid attendance rather than a physical head count of everyone inside the stadium. Under that system, schools report whichever number is higher: total paid attendance based on ticket sales and price tiers, or the actual number of people who scanned into the game.
That either-or structure surprises many fans. Paid attendance reflects every ticket distributed and paid for, whether the buyer walks through the gate or stays home. The turnstile or scan count, by contrast, captures everyone who actually enters, including holders of complimentary tickets and passes that were never “sold” at all. By taking the higher of the two figures, the NCAA methodology attempts to capture the truest measure of interest in a game, though it can also produce numbers that baffle observers who count empty sections from their own seats.
Student attendance is calculated separately and then added on top of the paid attendance total, following the same general framework used by other athletic departments nationwide. Because most students receive admission as part of their fees or through a designated student section rather than buying individual game tickets, folding them in separately keeps the accounting consistent across schools with very different ticket structures.
Why the number and the crowd can disagree
That approach means the announced number for any given game may not perfectly reflect the number of fans a spectator sees filling the seats, since it is built around ticket accounting rather than a literal count of bodies in the stadium. Season ticket holders who skip a game remain in the paid total. Fans who scanned in on comps show up in the scan count even if a season ticket holder did not. Weather, kickoff time and the opponent all influence how many ticket buyers actually convert their tickets into attendance.
For a program still growing its fan base and season-ticket sales, the gap between perceived and reported attendance can be especially noticeable to longtime supporters comparing games from week to week. A Saturday afternoon date against a regional opponent and a Friday night showcase against a nationally known program can produce announced figures that feel out of step with the visible crowds, simply because the composition of ticket sales and no-shows differs from one game to the next.
The bigger picture from the 2014 season
Despite the questions raised by the Navy game, South Alabama’s attendance figures for the 2014 season overall told a more positive story for the program. The Jaguars averaged more than 17,000 fans per home game across the season, a number that reflects continued growth in interest for a football program still in its first decade of competition at the FBS level.
That trajectory matters for a young program. South Alabama fielded its first football team only in 2009, played its early seasons as a rising program before jumping to the Football Bowl Subdivision, and has been building its season-ticket base and game-day traditions ever since. Averaging above 17,000 in a market that also supports high school football on Friday nights, the Senior Bowl and the city’s other entertainment options is the kind of growth curve athletic departments point to when making the case for continued investment.
The home venue itself shapes how fans perceive the crowds. Ladd-Peebles Stadium, the Mobile landmark where the Jaguars play their home games, was built for an era when Mobile’s biggest crowds gathered for high school championships and the Senior Bowl, and its size means that announced figures in the mid-teens of thousands leave visible stretches of empty seating even on strong-drawing nights. Fans see the gaps; the accounting sees the tickets. Both views are accurate, which is precisely why the conversations keep recurring.
A familiar debate across college football
The attendance conversation is a familiar one in college athletics, where programs of all sizes occasionally face skepticism from fans about whether reported numbers match what they see from their seats. The question surfaces every fall at programs ranging from small regional schools to national powers, and it tends to flare up around marquee nonconference games, when visiting fan bases and casual supporters swell the visible crowd beyond what the ticket ledger would predict.
The NCAA’s framework has been the subject of periodic criticism for exactly this reason. Defenders of paid-attendance reporting note that season-ticket commitments represent real financial support for an athletic department whether or not the holder attends, and that a program’s ability to sell tickets is a more meaningful measure of fan engagement than one night’s turnstile total. Critics counter that the practice lets schools announce flattering figures for games that looked half-empty on television, feeding a cycle of skepticism among the very fans the numbers are meant to impress.
Some programs have experimented with more transparent approaches, publishing scanned-attendance figures alongside paid totals or breaking out complimentary admissions in their reports. There is no indication South Alabama plans to change how it reports; officials say the counting method is consistent with practices used across the sport, even if it does not always match a quick visual estimate from the stands.
What it means for the Jaguars
For South Alabama, the Navy game debate was in one sense a good problem to have. Fans who care enough to argue about an attendance figure are fans who showed up, bought tickets or watched closely enough to notice — engagement that a program in its first decade of FBS competition cannot take for granted. The Friday night stage against a service academy was the kind of game that introduces the program to new audiences in Mobile and beyond, and the discussion it produced kept the Jaguars in local conversation well after the final whistle.
Officials, for their part, used the moment to explain rather than defend. By walking through the paid-versus-scanned methodology, the separate student calculation and the NCAA rules that produce the final figure, the athletic department turned a skeptical fan thread into a public accounting lesson, one that will likely resurface the next time an announced number strikes the Ladd-Peebles crowd as out of step with the stands.
The season’s bottom line — an average of more than 17,000 fans per home game and continued growth for a program barely ten years old — gave supporters the more meaningful statistic to carry forward, whatever they thought of any single Friday night’s figure.
How the numbers are assembled on game day
Behind every announced figure is a chain of counts that starts well before kickoff. Season tickets, mini-plans, group sales and single-game purchases are tallied into the paid figure as they are sold, while complimentary admissions — allotted for recruits, sponsors, marching band family members, community groups and team operations — sit outside the paid ledger but can surface in the scan count if the holders attend. On game day, barcode scanners or turnstile systems log entries, students check in through their own process, and the athletic department combines the pieces into the number that goes to the NCAA and appears in the box score.
Because the school reports whichever figure is higher, a game with heavy no-shows among paid ticketholders can still post a strong announced number if scanning runs high, and a lightly attended game with a big student turnout can outdraw its paid total. The Navy game’s 14,571 fit somewhere in that machinery — a figure fans found hard to reconcile with their memories of the stands, but one assembled by the same rules used at programs across the country.
The announced number also carries consequences beyond fan debate. Attendance figures feed into conference reporting requirements, NCAA statistics and the program’s public record, and they shape the perception of a program’s health among sponsors, donors and bowl organizers. For a young athletic department working to establish itself in the Sun Belt Conference and in a competitive Mobile sports market, the announced average is part of its calling card, which is why officials take care to explain how it is built rather than let the fan-page theories harden into fact.
Season-ticket growth and the road ahead
The 2014 season’s average of more than 17,000 per home game represents the kind of steady climb athletic departments look for in a program’s first decade. Every incremental gain in season-ticket sales provides revenue stability that single-game walk-ups cannot, and the Jaguars’ staff has invested in promotions, group outings and community events designed to convert casual interest into standing commitments.
Friday night games add another wrinkle. Moving a home game from Saturday to Friday captures a regional television audience and avoids conflicts with bigger Saturday schedules, but it also asks fans to rearrange work, school and travel routines — a tradeoff that can affect how many ticket holders actually attend. Against Navy, with the academy’s traveling support and the pageantry of a service academy visit, the crowd carried the energy of a bigger night even if the announced figure read modest.
The takeaway from the week’s debate is that both camps were partly right. The fans who remembered a lively stadium were describing a real crowd; the officials defending 14,571 were describing a real accounting. College football attendance, by design, reports the business of the game rather than the snapshot of it, and at South Alabama — a decade-old program with a growing base, a historic stadium and an average above 17,000 — the numbers and the noise are converging more often than the one-night controversies suggest.
As the program continues to build, the gap between what the stands look like and what the box score says will likely keep narrowing, one sold season ticket at a time.