NWS Launches One-Stop Hurricane Tracking Portal for Gulf Coast Residents
The National Weather Service Southern Region has combined storm surge maps, threat and impact graphics, and other hurricane season tools into a single online portal for Gulf Coast residents.
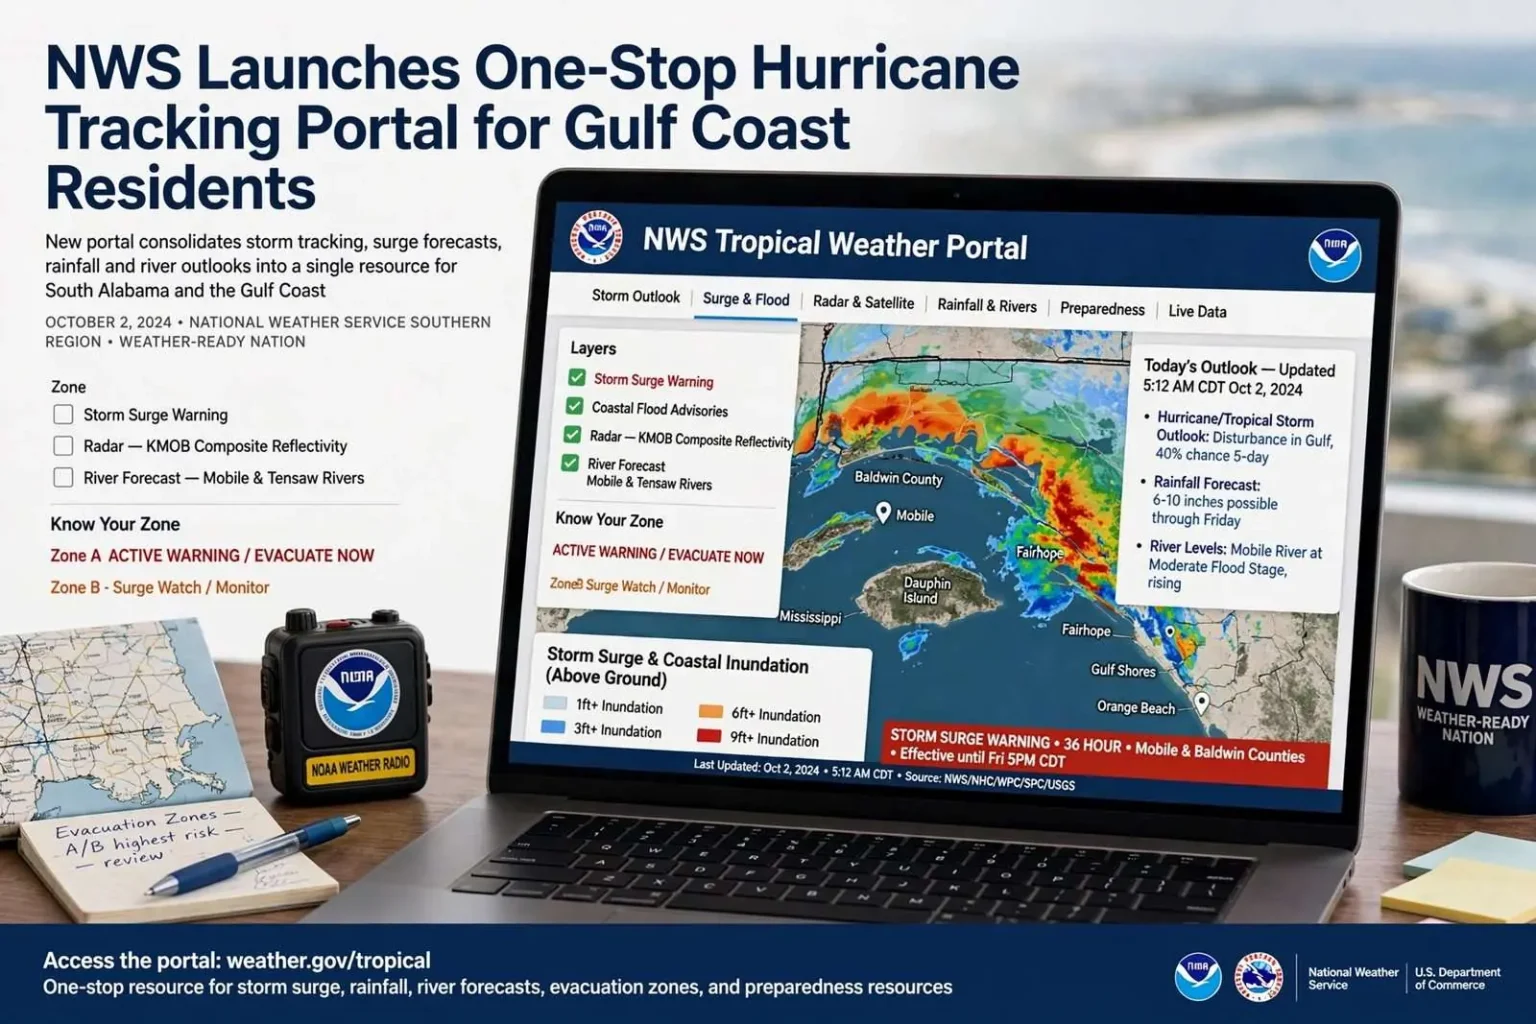
As hurricane season continues across South Alabama, the National Weather Service Southern Region has consolidated its storm-tracking tools into a single online destination designed to help residents prepare for and respond to tropical weather. The tropical web portal brings together storm outlooks, active storm information, threat and impact graphics, satellite and radar imagery, and preparedness resources in one place, giving Gulf Coast residents a one-stop shop during hurricane season.
The portal represents a significant evolution in how the National Weather Service delivers operational products to the public. For decades, hurricane information was scattered across multiple websites — the National Hurricane Center in Miami for official forecasts and advisories, local Weather Forecast Office sites for county-level warnings, the Weather Prediction Center for rainfall forecasts, the Storm Prediction Center for tornado and severe weather outlooks, and various NOAA sub-sites for storm surge, river flooding, and coastal inundation data. A resident in Mobile or Baldwin County seeking a complete picture had to navigate half a dozen URLs, each with its own interface, update cadence, and technical jargon.
Storm Surge and Coastal Flooding
One of the portal’s key features displays storm surge and coastal flood hazards, along with potential inundation levels, using data from the National Hurricane Center and National Weather Service GIS services. The map shows hazard categories ranging from coastal flood statements and advisories to full watches and warnings, as well as storm surge watches and warnings specific to tropical systems. Potential inundation is depicted in bands showing water levels greater than 1 foot, 3 feet, 6 feet and 9 feet above ground, giving residents a visual sense of how high floodwaters could rise in a given area.
Storm surge remains the deadliest hazard associated with tropical cyclones along the Gulf Coast. Hurricane Katrina in 2005 produced surge levels exceeding 25 feet in parts of coastal Mississippi, with devastating effects extending into Alabama’s western shore. Hurricane Ivan in 2004 drove a 10-to-15-foot surge into Mobile Bay, flooding downtown Mobile, the Causeway, and communities along the Eastern Shore. Hurricane Sally in 2020, though only a Category 2 at landfall, stalled offshore and pushed 5 to 7 feet of surge into areas that had not seen such levels in decades. The portal’s inundation bands — particularly the 6-foot and 9-foot thresholds — correspond directly to the elevations at which critical infrastructure fails: the 6-foot band covers most of the Causeway (US-90/98 across Mobile Bay), while the 9-foot band reaches the floor elevation of many homes in low-lying neighborhoods of Mobile, Daphne, Fairhope, and Gulf Shores.
A storm surge watch means life-threatening inundation from a tropical cyclone is possible, generally within 48 hours, while a storm surge warning means that danger is expected generally within 36 hours. Coastal flood watches and warnings are used instead in Southern California, where storm surge products don’t apply. The distinction matters because storm surge warnings trigger specific evacuation protocols under Alabama’s emergency operations plan, while coastal flood warnings may not. The portal makes this distinction visible on a single map layer, reducing the risk that a resident in Baldwin County confuses a coastal flood advisory with a storm surge warning and delays evacuation.
Beyond tropical systems, the portal offers rainfall forecasts, excessive rainfall outlooks and thunderstorm outlooks covering the next seven days, drawing on data from the Weather Prediction Center and the Storm Prediction Center. Fire weather outlooks for the next five days are also included, courtesy of the Storm Prediction Center. Rounding out the hydrology tools are national river observations and forecasts, tide and current predictions, and a NOAA inundation dashboard, all useful during the prolonged flooding that often follows a tropical cyclone’s landfall.
The integration of rainfall and river forecast data addresses a persistent gap in hurricane preparedness. Hurricane Harvey in 2017 — though it made landfall in Texas — demonstrated that inland flooding from extreme rainfall can exceed surge damage in both geographic extent and duration. Alabama’s river systems — the Mobile, the Tensaw, the Alabama, the Tombigbee, the Black Warrior — drain a watershed covering roughly 44,000 square miles. A slow-moving tropical system dropping 15 to 20 inches of rain across the Mobile-Tensaw Delta can keep river stages above flood stage for weeks, cutting off communities in the delta, threatening the drinking water intake for Mobile and Prichard, and backing up stormwater systems in urban areas. The portal’s river forecast layer, fed by U.S. Geological Survey stream gauges and NWS river forecast models, lets emergency managers track the progression of flood waves downstream in near real time.
Radar, Satellite, and Preparedness
Satellite and radar imagery on the portal includes GOES-East visible, infrared, and water vapor channels, as well as composite reflectivity from the NEXRAD network covering the Gulf Coast. The Mobile NEXRAD (KMOB), located at the National Weather Service office on the campus of the Mobile Regional Airport, provides coverage out to roughly 250 nautical miles over the Gulf of Mexico, the Florida Panhandle, and southern Alabama. Its low-level scans are critical for detecting the mesovortices and tornadoes that often spin up in the outer rainbands of landfalling hurricanes — a hazard that caused significant damage in Baldwin County during Hurricane Sally and in Mobile County during Hurricane Zeta in 2020.
The preparedness section of the portal links to Alabama-specific evacuation zone maps, shelter information coordinated by the Alabama Emergency Management Agency, and the “Know Your Zone” campaign that assigns every coastal address a letter designation (A through E) based on its vulnerability to storm surge. Zone A, the most vulnerable, includes the barrier islands — Dauphin Island, the Gulf Shores/Orange Beach corridor, and the Fort Morgan peninsula — as well as low-lying areas along Mobile Bay and the Intracoastal Waterway. The portal’s integration of zone boundaries with real-time surge forecasts allows a resident to see, at a glance, whether their zone is under a watch or warning and what the expected inundation level is for their specific area.
Development and Regional Context
The portal was developed by the NWS Southern Region Headquarters in Fort Worth, Texas, in collaboration with the National Hurricane Center, the Weather Prediction Center, the Storm Prediction Center, and the six Weather Forecast Offices that serve the Gulf Coast: Lake Charles, New Orleans/Baton Rouge, Mobile/Pensacola, Tallahassee, Houston/Galveston, and Brownsville. The Mobile/Pensacola office, located at the Mobile Regional Airport, has warning responsibility for Mobile, Baldwin, Washington, Clarke, Monroe, Conecuh, Escambia, Covington, and Butler counties in Alabama, plus Escambia, Santa Rosa, and Okaloosa counties in Florida. Its forecasters contributed the local knowledge that shaped the portal’s Gulf Coast–specific layers — the Causeway inundation thresholds, the Mobile Bay storm surge dynamics, the delta river forecast points.
For South Alabama residents, the portal’s value extends beyond hurricane season. The same infrastructure that tracks tropical cyclones also serves the region’s other weather threats: the spring severe weather season that brings supercell thunderstorms and long-track tornadoes across the Black Belt; the summer pulse thunderstorms that produce flash flooding in urban watersheds like Three Mile Creek and Dog River; the winter cold snaps that threaten the citrus and nursery industries in Baldwin County; the drought cycles that affect row-crop agriculture in the Wiregrass and the timber industry in the Piney Woods. The excessive rainfall outlook, the thunderstorm outlook, the fire weather outlook, and the river forecast tools are active year-round, making the portal a persistent resource rather than a seasonal one.
The portal also reflects a broader shift in federal weather services toward integrated, impact-based decision support. The National Weather Service’s “Weather-Ready Nation” initiative, launched in 2011, emphasizes not just accurate forecasts but actionable information tailored to the decisions that emergency managers, transportation officials, school superintendents, and business owners must make when hazardous weather threatens. The tropical portal embodies this philosophy by presenting not just meteorological data — wind speeds, pressure tendencies, rainfall rates — but the derived products that translate those data into impacts: inundation maps, evacuation zone triggers, river crest forecasts, power outage potential indices.
For the Gulf Coast’s marine economy, the portal includes specialized products that address the unique vulnerabilities of the region’s working waterfronts. The commercial fishing fleet based in Bayou La Batre, the largest seafood processing hub in Alabama, relies on accurate surge and wave forecasts to decide when to seek safe harbor — a decision that balances the cost of lost fishing days against the risk of vessel loss. The Austal USA shipyard in Mobile, one of the region’s largest employers, uses the portal’s wind and surge data to schedule heavy-lift operations and protect unfinished hulls. The Port of Mobile, the nation’s twelfth-largest by tonnage, monitors the portal’s tide and current predictions to manage vessel traffic through the Mobile Bar Channel during tropical events.
Accessibility and Future Development
The portal is designed to function on mobile devices with limited bandwidth — a critical consideration for residents who may lose home internet service during a storm but retain cellular data access. Its map tiles are optimized for progressive loading, and its data layers can be toggled individually to reduce data usage. The NWS Southern Region has also published an API that allows third-party developers — local news stations, emergency management software vendors, university researchers — to embed portal data in their own applications, extending its reach beyond the NWS website itself.
Future enhancements under consideration include the integration of high-resolution storm surge modeling from the ADCIRC system, which simulates water levels at street-scale resolution for the Alabama coast; the addition of probabilistic tornado guidance specific to tropical cyclone rainbands; and the incorporation of crowd-sourced flood reports via the NWS’s Storm Reporter platform, which would allow residents to submit geotagged photos and observations that forecasters can use to verify and refine their products in real time. These developments would further close the gap between the forecaster’s screen and the resident’s decision point — the moment when a family in Bayou La Batre decides whether to evacuate, a business owner in Fairhope decides whether to sandbag, a school superintendent in Monroeville decides whether to cancel classes.
As the 2024 hurricane season progresses, the portal will face its first sustained operational test. The National Weather Service has encouraged feedback from users across the Gulf Coast — emergency managers, broadcast meteorologists, community leaders, and individual residents — to identify gaps, usability issues, and missing data layers. The portal’s URL, weather.gov/tropical, is intended to be memorable enough that it becomes the default starting point for Gulf Coast weather awareness, not just during hurricane season but throughout the year. For a region where the weather is never far from the conversation, a single, authoritative, integrated source of information represents a meaningful step toward a more weather-ready Gulf Coast.